Navigating Slower RevPAR Growth to Make Strategic Brand Selections
Executive Summary
- Slowing RevPAR growth and maturation of the U.S. hotel industry are driving brand proliferation to attract new customers. The average number of brands per brand family tracked by CBRE increased to 25 in 2023 from 13 in 2013.
- RevPAR growth fell to 1.5% between 2018 and 2023 from 3% between 2013 and 2018. Given that year-to-date 2024 RevPAR growth is lower than it was a year ago, we believe this slowdown is more reflective of increasing competition from alternative lodging sources rather than a lagging pandemic recovery.
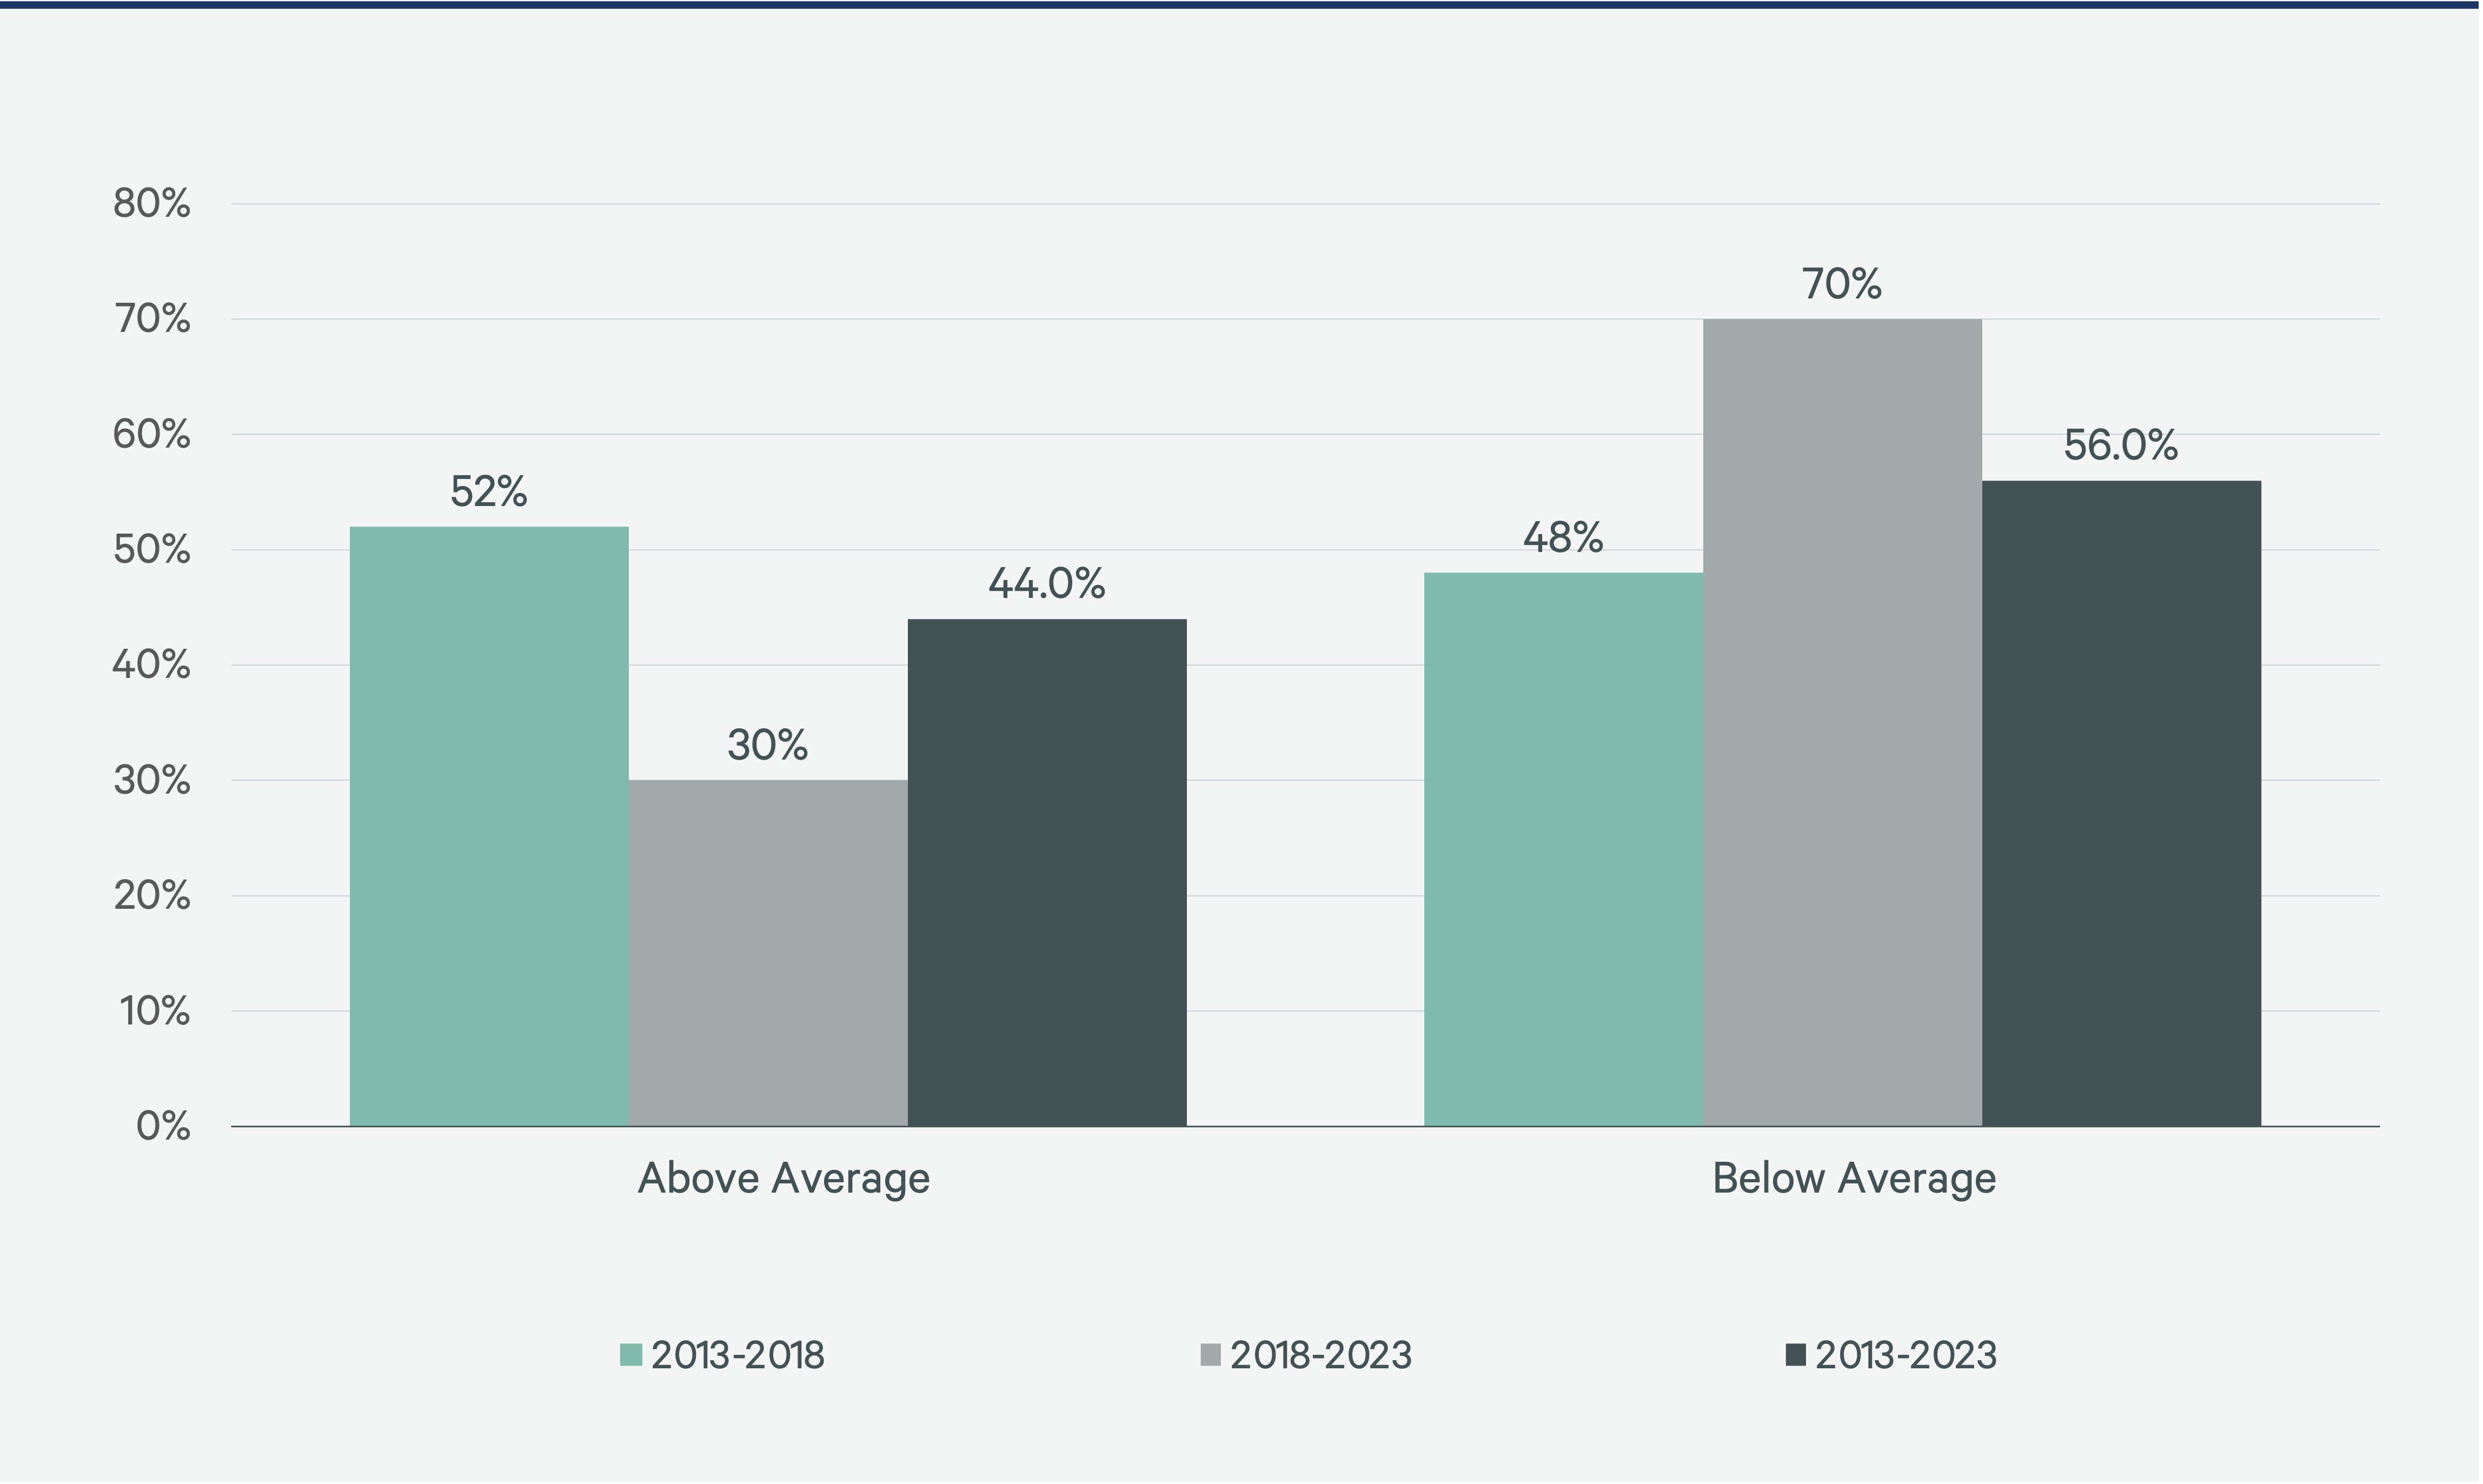
- To maximize profits, owners and developers must pick an attractive chain scale and an outperforming brand. Selecting a brand that outperforms the average has become increasingly difficult. Only 30% of brands delivered above-average RevPAR growth over the past five years, down from the 52% of brands with above-average RevPAR from 2013 to 2018.
- A chain scale doesn’t determine RevPAR performance; there is a wide range of performance among brands. Over the past five years, the top-performing brands outperformed their lagging chain scale counterparts by as much as 79%. Assuming a flow-through multiple of 1.5x to 2.0x from revenues to GOP, this implies up to 160%incremental profit performance.
- Between 2013 and 2023, only 26% of the same-store brands in this analysis generated RevPAR growth above inflation. Between 2018 and 2023, largely due to high inflation levels beginning in 2021, only 3% of these brands boasted RevPAR above inflation. Even if inflation had remained below 2% over the past five years, 70% of these brands would still have lagged inflation with an average RevPAR growth of just 1.3%.
- Upper-midscale chains were the best performers over both five-year periods examined. Free breakfast, strong brand recognition, no resort fees and the ability to attract guests who trade both up and down have increased the appeal of select-service hotels.
Brand Growth & Benefits
The six large brand families tracked by CBRE for this report increased their number of brands to 25 from 13 between 2013 and 2023, resulting in a compound annual growth rate of 7%.
The benefits of brand affiliations for hotel developers and owners include favorable management agreements, mezzanine financing, cost efficiencies through bulk supplier contracts, key money and access to a growing number of loyalty members. All of these can help support occupancy and lower customer acquisition costs.
Slower RevPAR Growth
Despite a return to pre-pandemic levels for most brands, overall RevPAR growth has slowed over the past five years as the hotel industry matured and brands proliferated. For this report, we analyzed key performance indicators of 50 hotel brands for each year between 2013 and 2023.
Comparing the five years from 2013 to 2018 with the most recent five-year period (2018 to 2023), RevPAR growth fell by half to 1.5% from 3.0%. While some of the slowdown could be a sign of the industry’s maturation, competitive encroachment from short-term rentals could also explain some of the deceleration. Short-term rentals’ share of total room nights has more than doubled since 2018 to over 16%, limiting average daily rate (ADR) and occupancy growth for hotels.
Fewer brands are keeping pace with the overall average RevPAR performance, with just 30% exceeding the average over the past five years. Seventy percent underperformed the average compared with just 48% in the previous five-year period.
Figure 1: Percentage of 50 Selected Hotel Brands With Above- & Below-Average RevPAR Growth
— Source: Choice, Hilton, Hyatt, IHG Hotels & Resorts, Marriott, Wyndham public filings.
RevPAR Growth Struggles to Keep Up With Inflation
Between 2013 and 2023, only 26% of the same-store brands in this analysis generated RevPAR growth above inflation. Between 2018 and 2023, that fell to just 3% of brands due to historic levels of inflation. Even if inflation had remained below 2% over the past five years, 70% of brands would still have lagged inflation with average RevPAR growth of just 1.3%.
Figure 2: Inflation vs. RevPAR Growth, 2018 to 2023


— Source: Choice, Hilton, Hyatt, IHG Hotels & Resorts, Marriott, Wyndham public filings, St. Louis Federal Reserve.
RevPAR Growth by Chain Scale
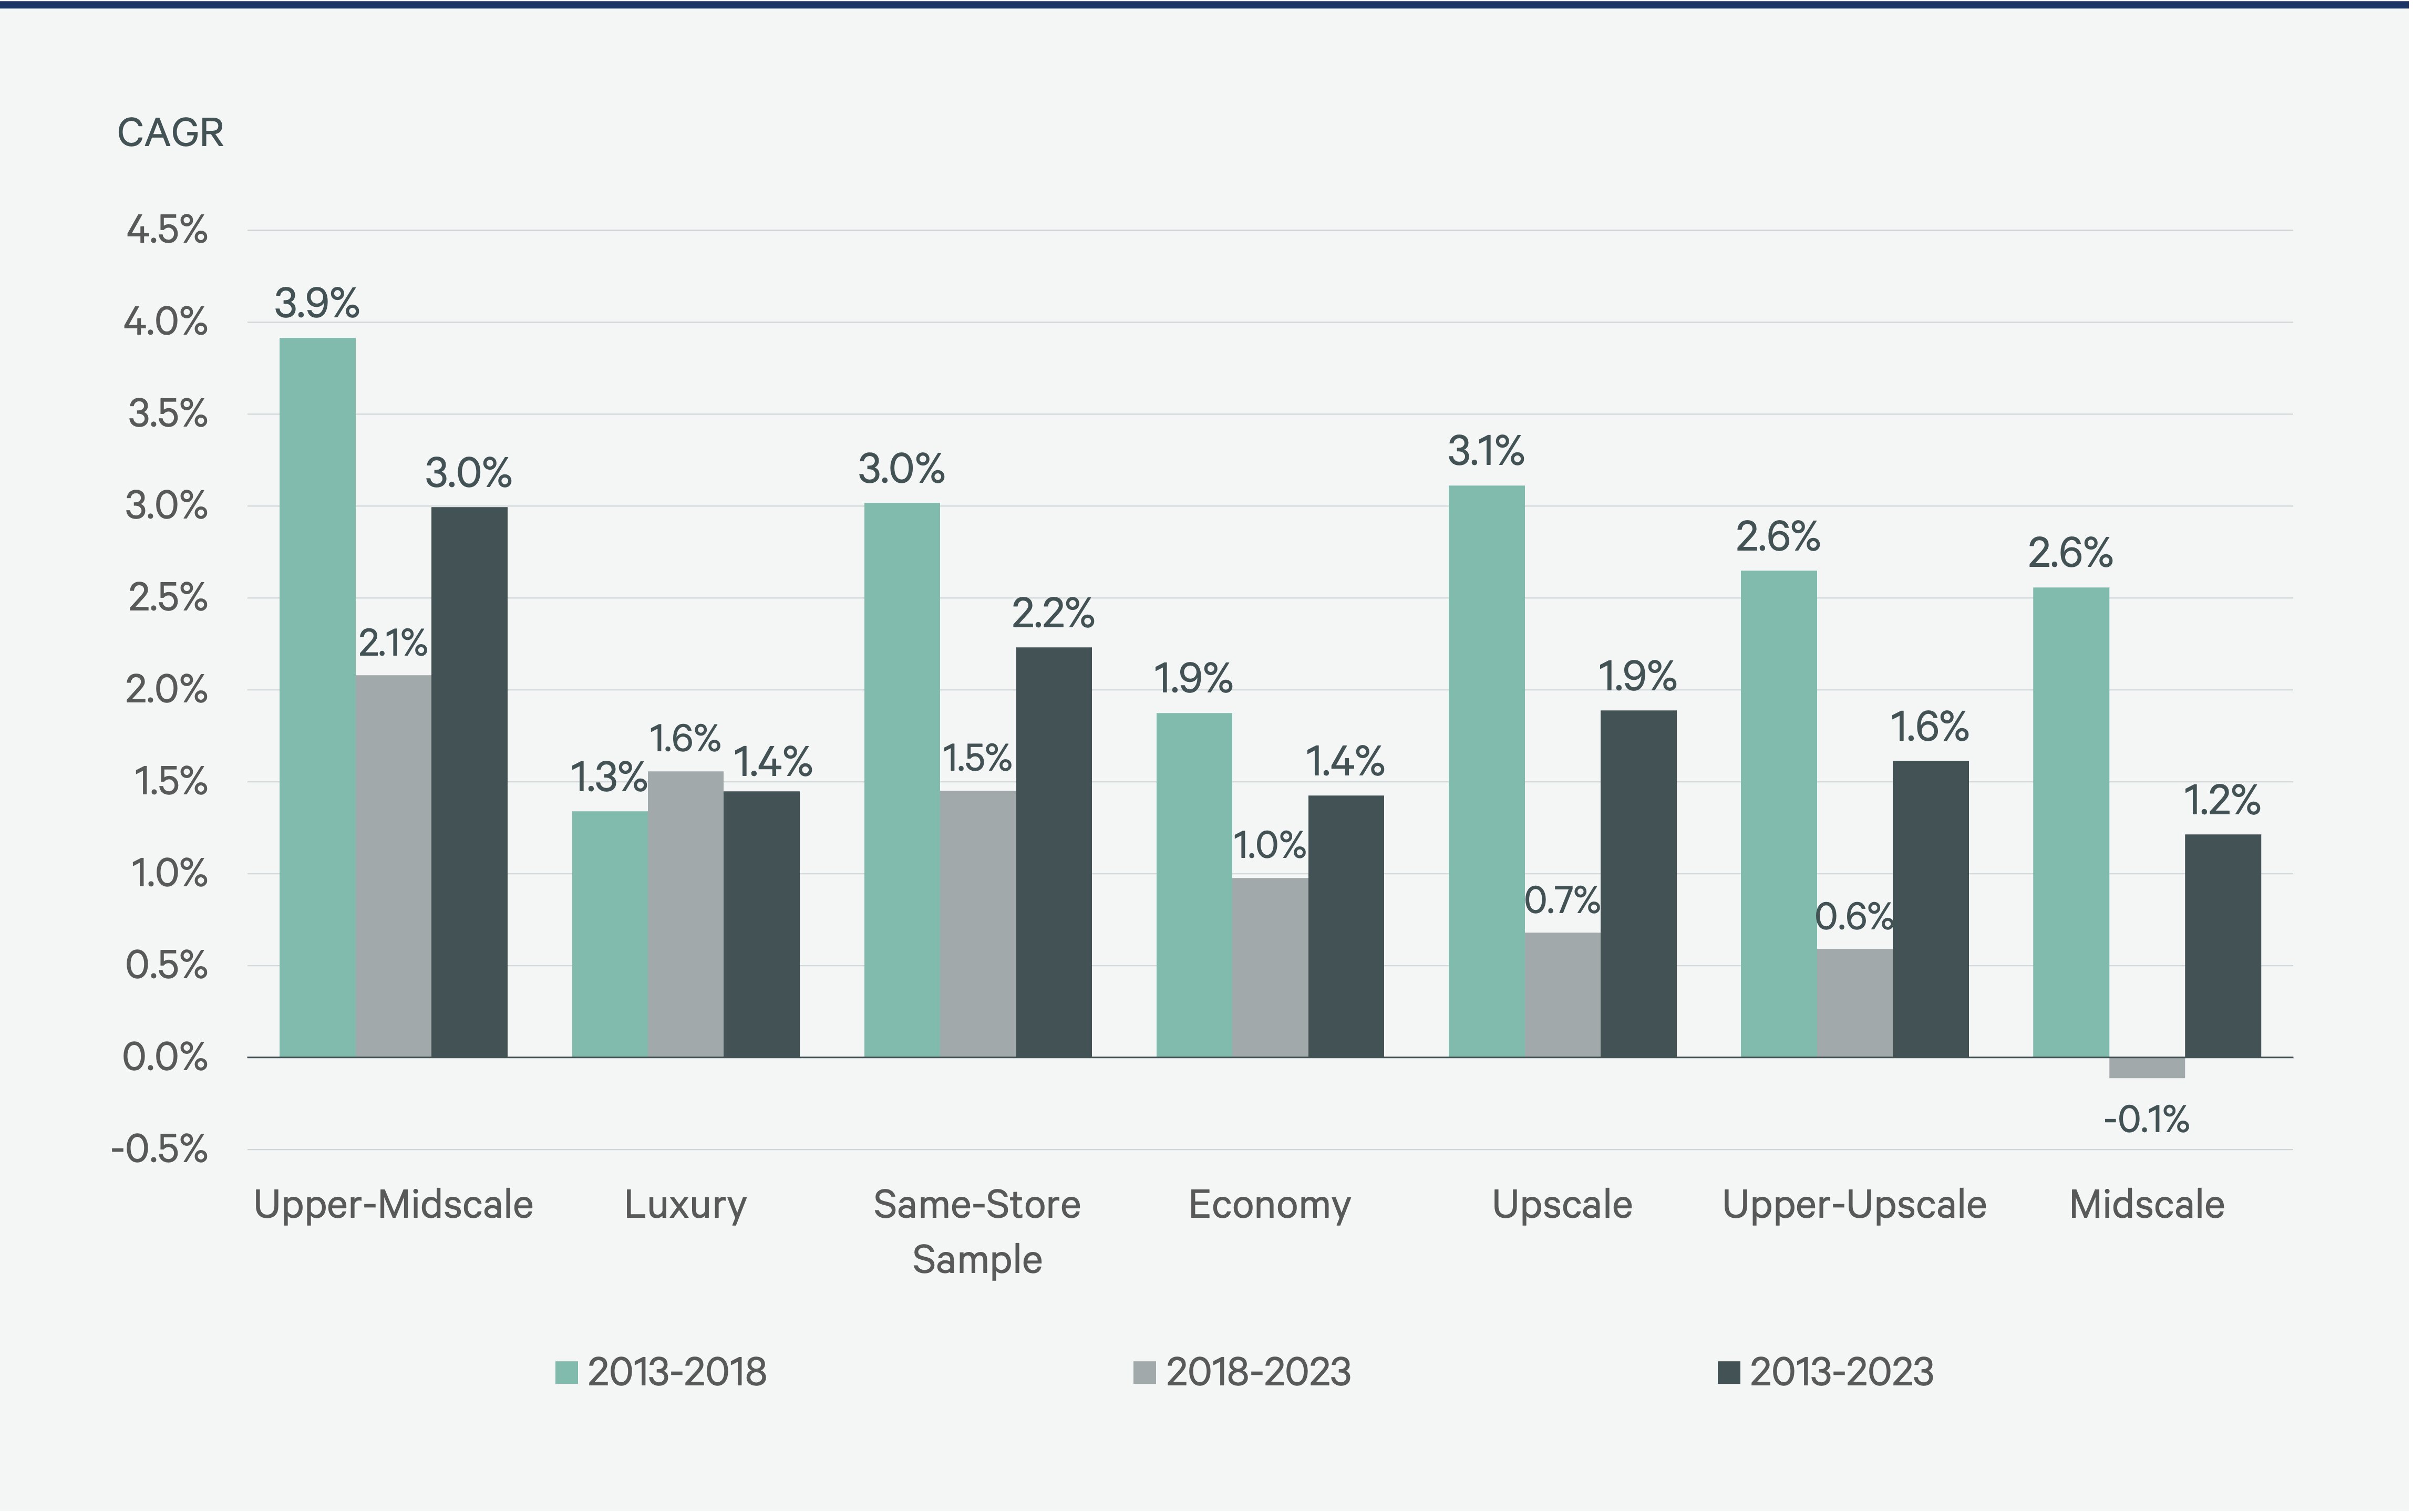
When comparing the two five-year periods, luxury was the only chain scale with accelerating RevPAR growth (1.6% vs. 1.3%). Luxury also was the only chain scale with higher room growth between the two five-year periods (2.4% vs. 1.7%), which could be contributing to stronger top-line growth as more properties stabilize post-opening.
RevPAR growth for upper-upscale chains dropped to 0.6% between 2018 and 2023 from 2.6% between 2013 and 2018. The slow recovery of business transient travel and stagnant pace of return to office may have contributed to the deceleration in growth.
Upper-midscale chains were the best performers over both five-year periods. Free breakfast, strong brand recognition, the lack of resort fees and the ability to capture guests who both trade up and trade down have increased the appeal of select-service hotels. For upper-midscale chains, although growth slowed to 2.1% between 2018 and 2023 from 3.9% between 2013 and 2018, RevPAR growth for this chain scale still outperformed the same-store sample over all periods.
For the 19 upper-midscale and upscale brands we tracked, upper-midscale outpaced upscale RevPAR growth by 140 basis points annually over the past five years. The RevPAR premium for upscale chains relative to upper-midscale chains fell by 24% to $17 in 2023 from $22 in 2018. The outperformance could result from differences in the strength of the brands in each category or the attractiveness of the lower price point to guests.
RevPAR for the upper-midscale chains has also strengthened relative to midscale chains. The gap in RevPAR between the two chain scales widening by nearly 28% since 2018, suggesting that guests are willing to pay the $41 premium for what they perceive as incremental value.
Over the past five years, midscale chains have experienced minimal room growth from legacy brands as increased financing and construction costs hampered the profitability of new construction. RevPAR fell by 0.1% between 2018 and 2023, compared with the 2.6% growth in the previous five years. These legacy brands may have been hindered by the launch of newer midscale brands.
Economy chain RevPAR growth rate fell to 1.0% between 2018 and 2023 from 1.9% between 2013 and 2018. The RevPAR performance is likely buoyed by the survivorship bias created by the significant contraction in the number of rooms over the last five years down 10.8% in total. This contraction in rooms may have been caused by the pandemic or conversion to alternative uses, given the 2023 RevPAR for our economy chain scale data set was only $35.
Choosing the Right Brand
Choosing the right brand within each chain scale can have sizable financial consequences. For example, the difference in annual RevPAR growth between the strongest and weakest upper-midscale brands over the past five years was 5.2 percentage points, resulting in a nearly 39% or $63 cumulative outperformance for the top-performing brand.
The cumulative premiums of the luxury and upscale chains were even higher at 79% and 74%, respectively. However, this outperformance cannot be attributed to a difference in RevPAR levels, as the RevPAR gap between the strongest and weakest brands was $3 for luxury chains and $11 for upscale chains.
Over 10 years, the performance gap among upper-midscale, upscale and luxury brands is narrower, indicating that the difference in performance between the weakest and strongest brands has widened over the past five years.
Figure 3: RevPAR Growth by Chain Scale

— Source: Choice, Hilton, Hyatt, IHG Hotels & Resorts, Marriott, Wyndham public filings.
Complimentary Breakfast Drives Performance
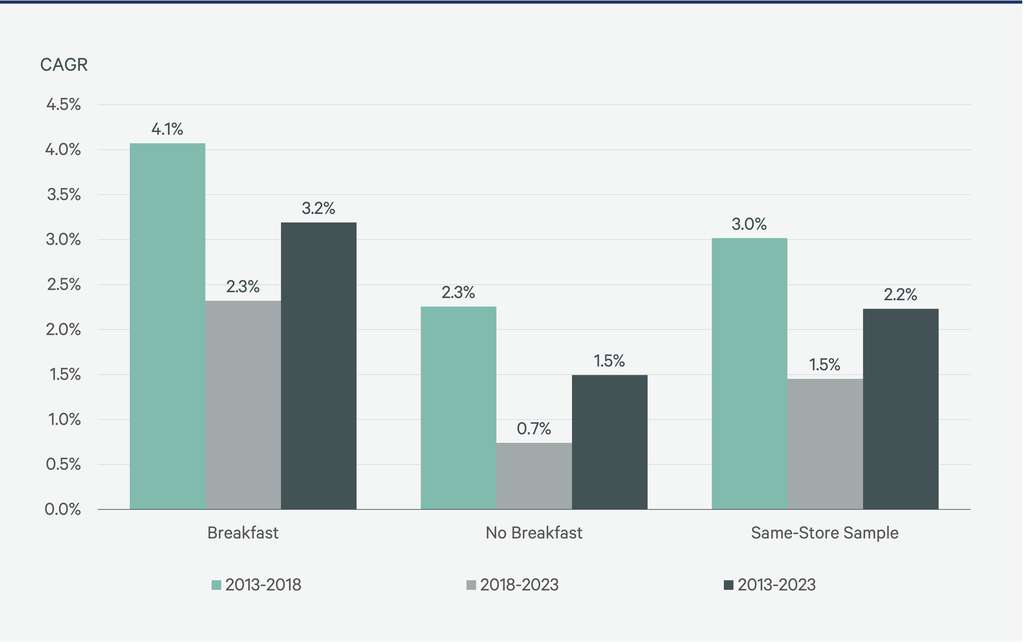
Brands that offer guests complimentary breakfast outperformed in our sample, with RevPAR growth more than double that of brands without complimentary breakfasts since 2013. Perhaps this could explain the outperformance of the upper-midscale brands, which are more likely to offer this amenity.
Figure 4: RevPAR Growth for Brands Offering Complimentary Breakfast vs. Those That Don’t

— Source: Choice, Hilton, Hyatt, IHG Hotels & Resorts, Marriott, Wyndham public filings.
Hotels offering complimentary breakfast vs. those that don’t have had twice as much RevPAR growth since 2013.
Extended-Stay & Limited-Service Outperform Full-Service Brands
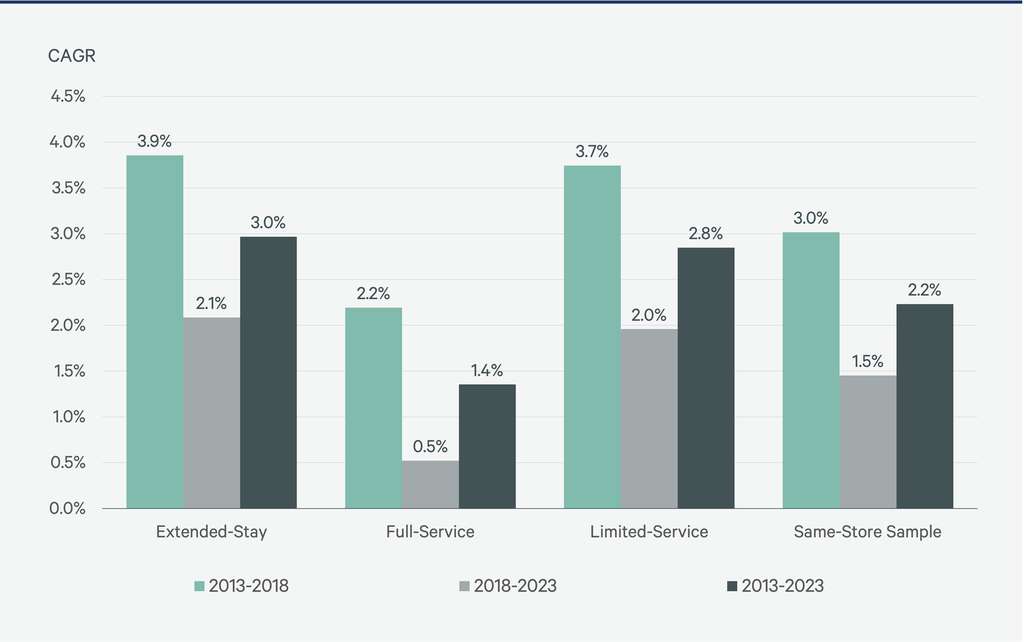
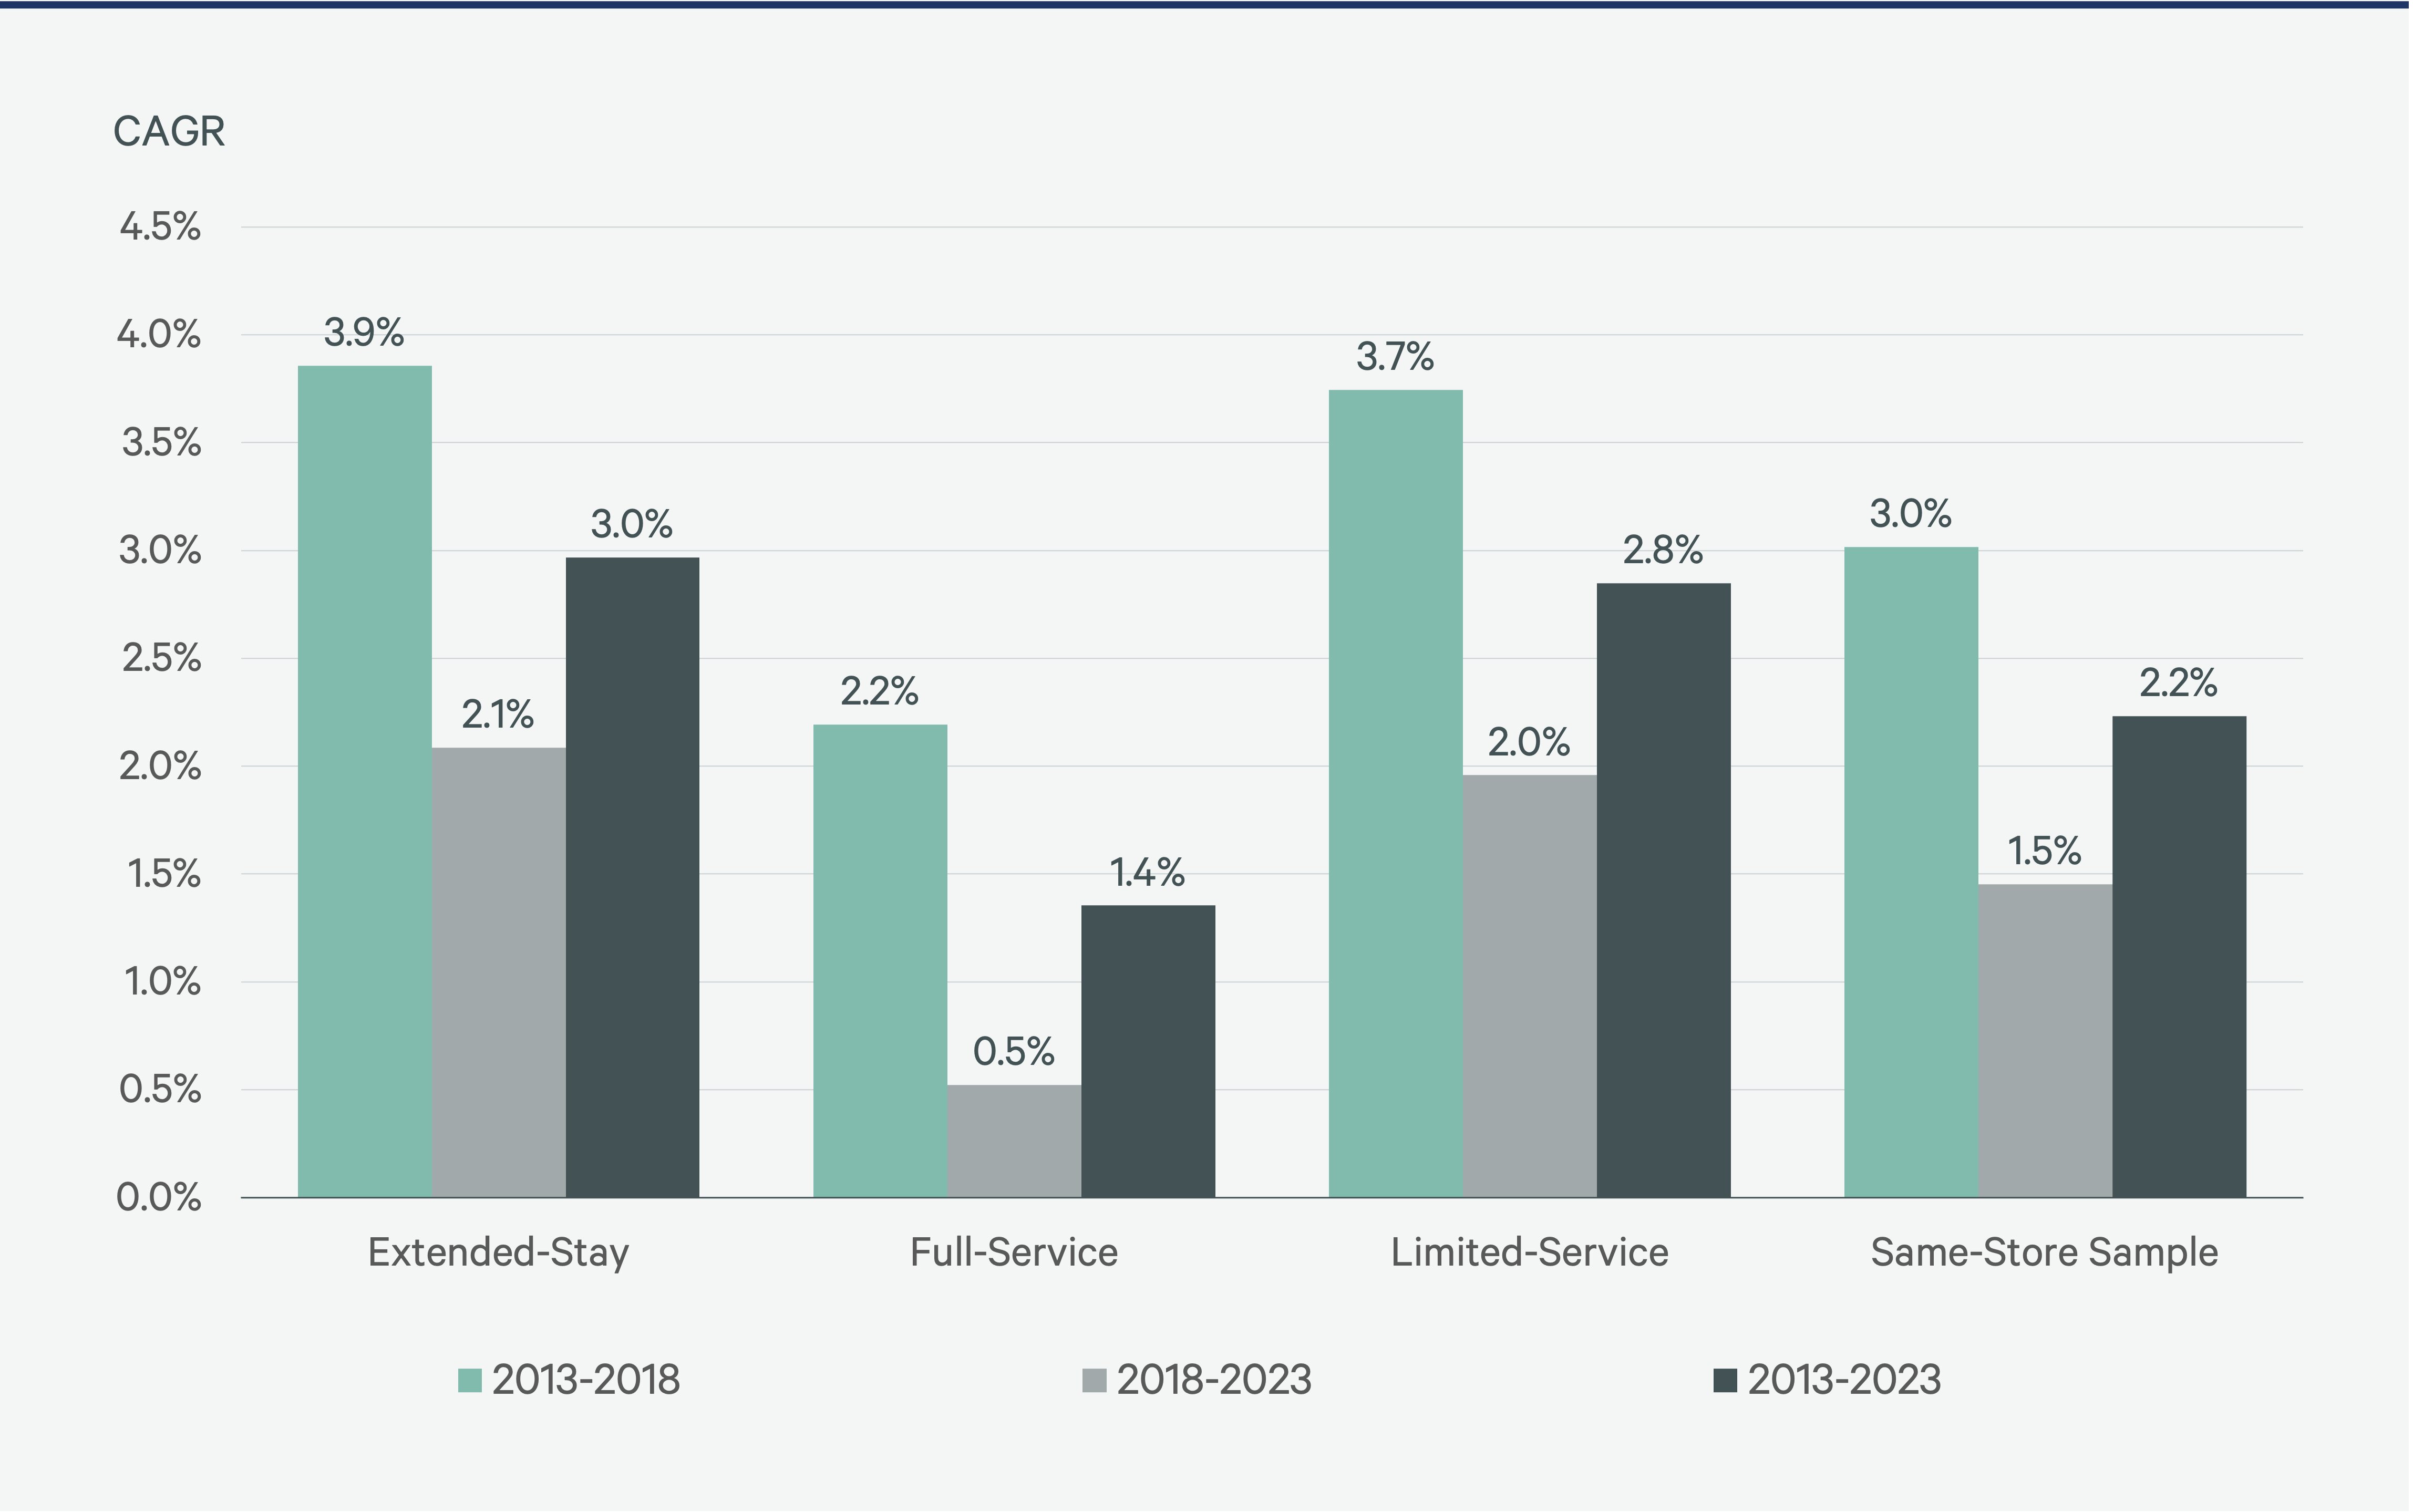
Extended-stay has been a popular segment among hotel developers since 2013, increasing room count by 6.1%—nearly three times the sample average growth rate. While extended-stay RevPAR growth fell to 2.1% between 2018 and 2023 from 3.9% between 2013 and 2018, it remained higher than the same-store growth rate of all brands. Owners and developers appear to increasingly favor extended-stay over limited-service hotels because of lower costs, despite the similar RevPAR growth rate for both segments.
Limited-service brands have consistently beaten full-service for RevPAR growth over both comparison periods. In the past five years, RevPAR growth for the limited-service brands was four times that of the full-service group.
Full-service urban hotels underperformed the overall group average, with RevPAR growth falling to 0.5% between 2018 and 2023 from 2.2% during the previous five years. With the slow recovery of business transient travel and office attendance, full-service hotels have been the last segment to recover to pre-pandemic levels. One-third of the brands in this segment have not yet returned to 2019 levels, consistent with broader trends in the same-store group.
Figure 5: RevPAR Growth by Segment
— Source: Choice, Hilton, Hyatt, IHG Hotels & Resorts, Marriott, Wyndham public filings.
Brand Selection Becoming More Difficult
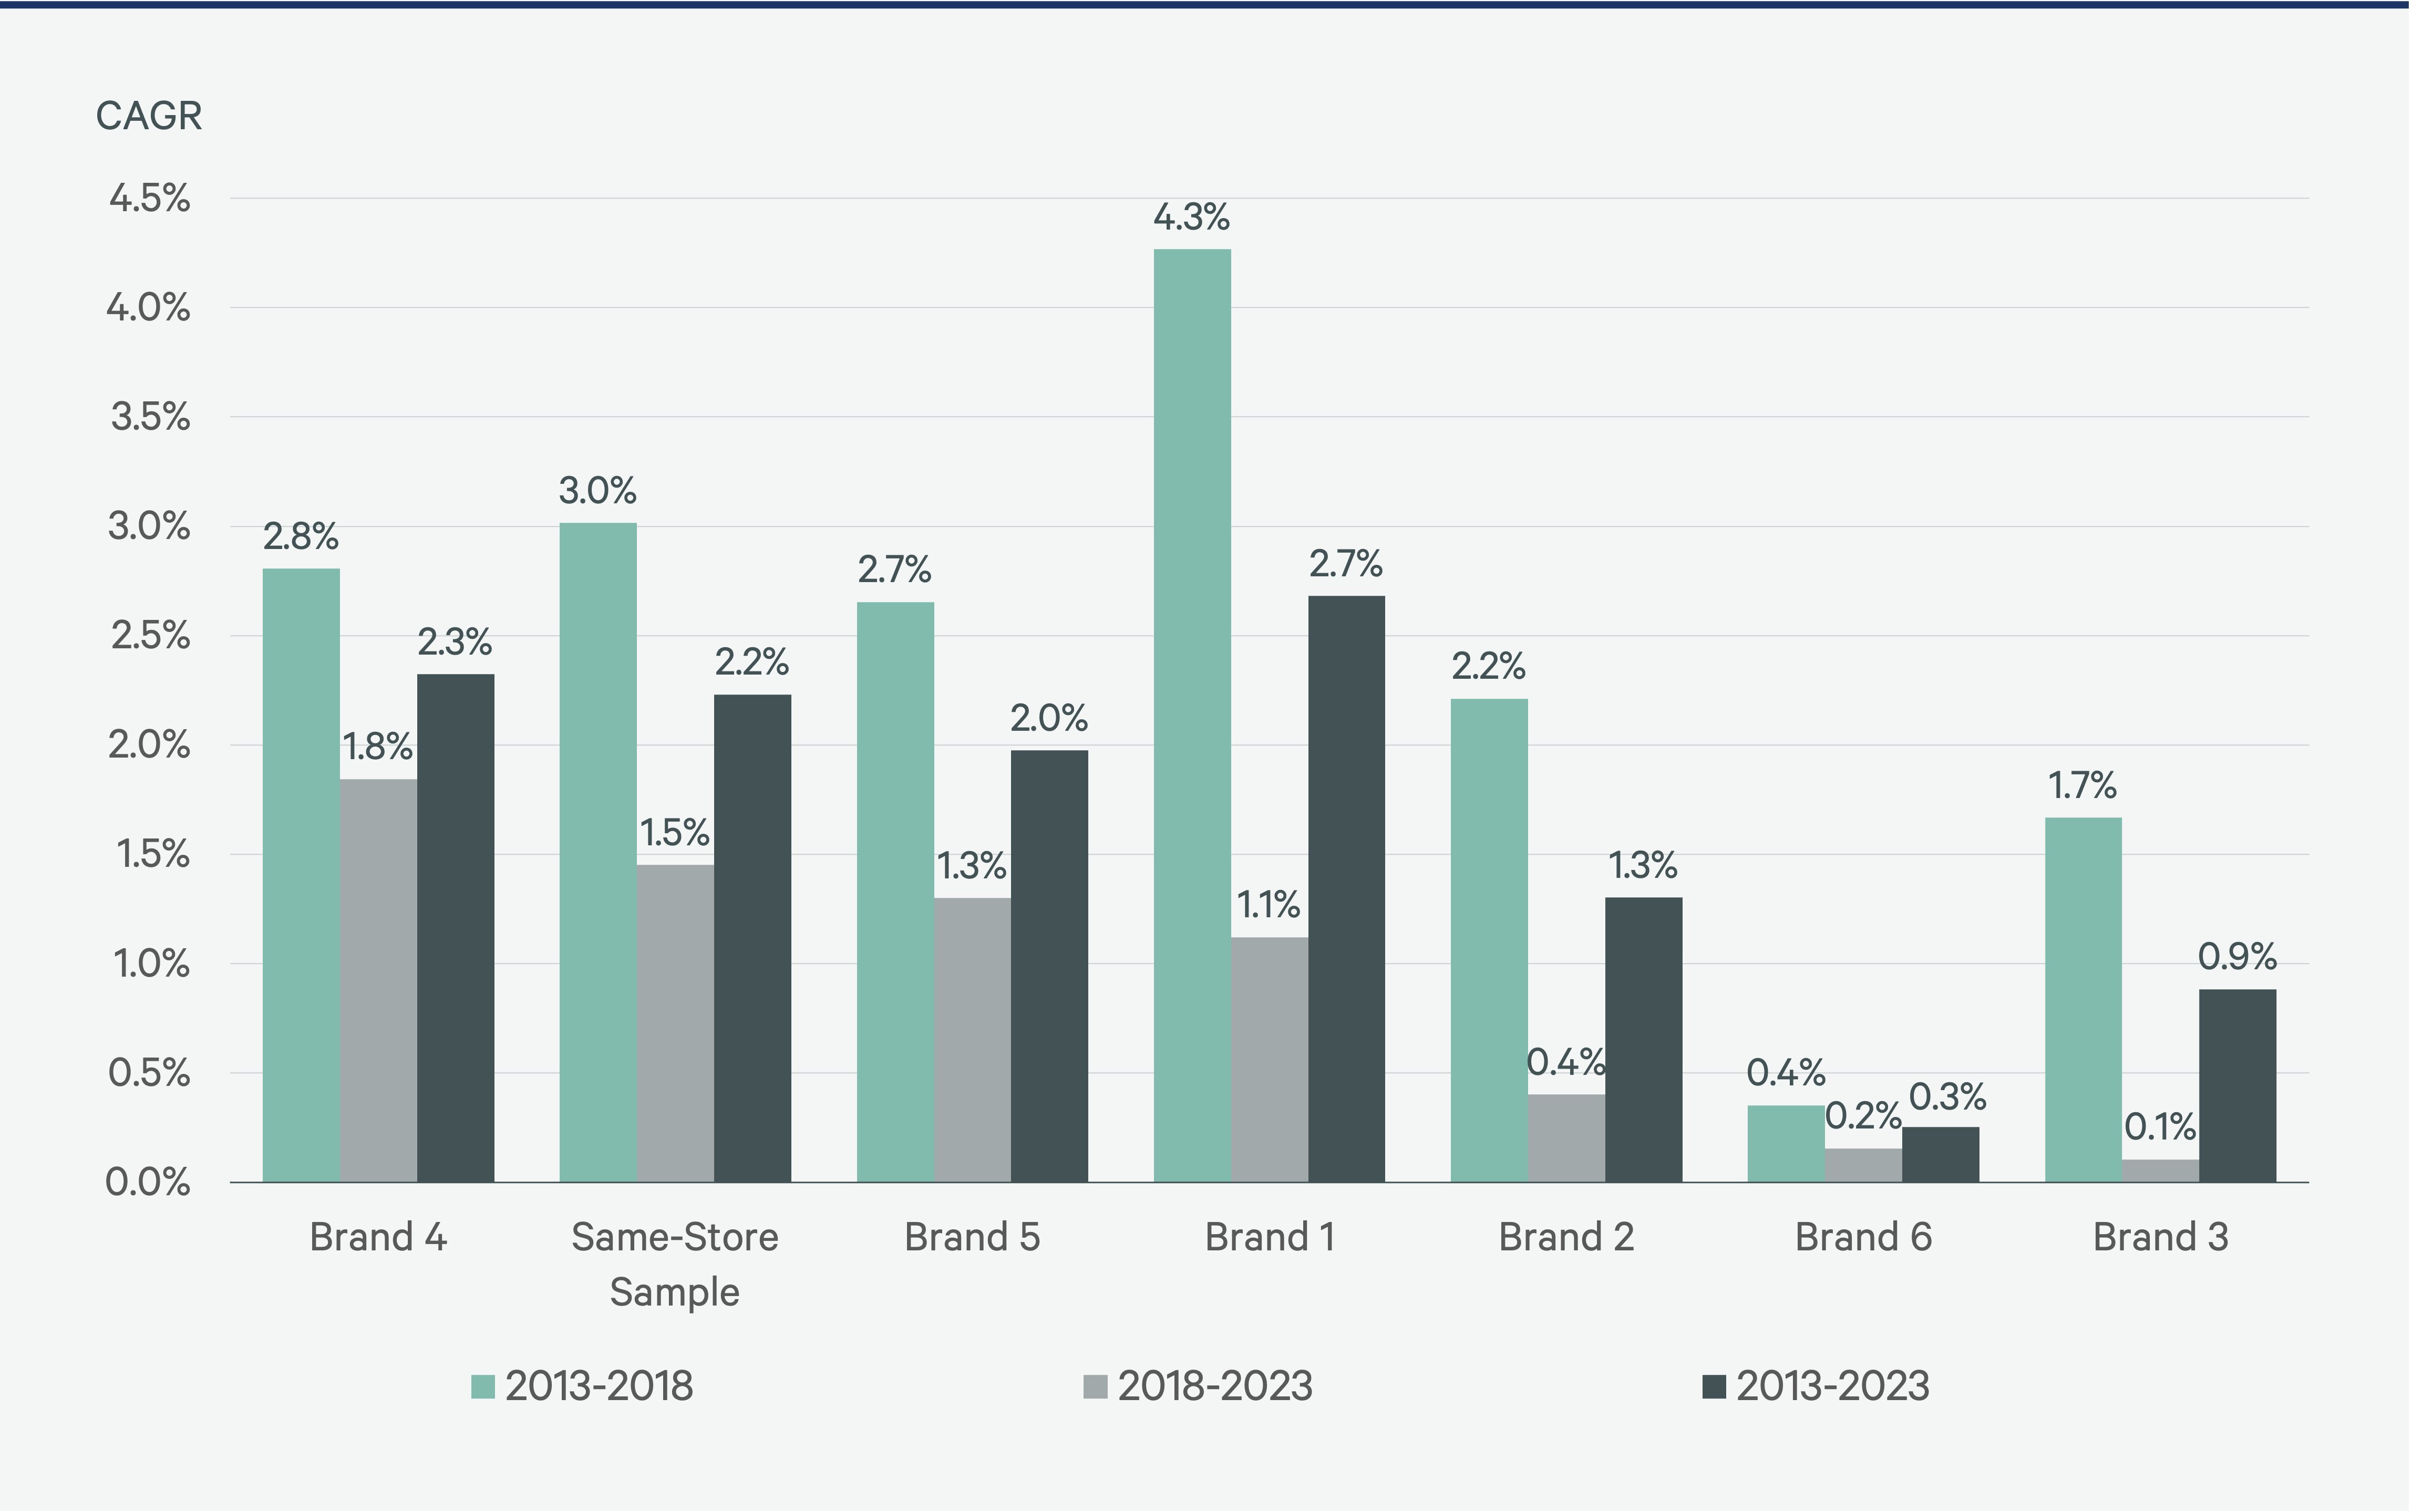
Before affiliating with a hotel brand, consideration must be given to the performance and reputation of all other brands within the selected brand family. Ranked by RevPAR growth, the top three brand families were the same for both five-year periods.
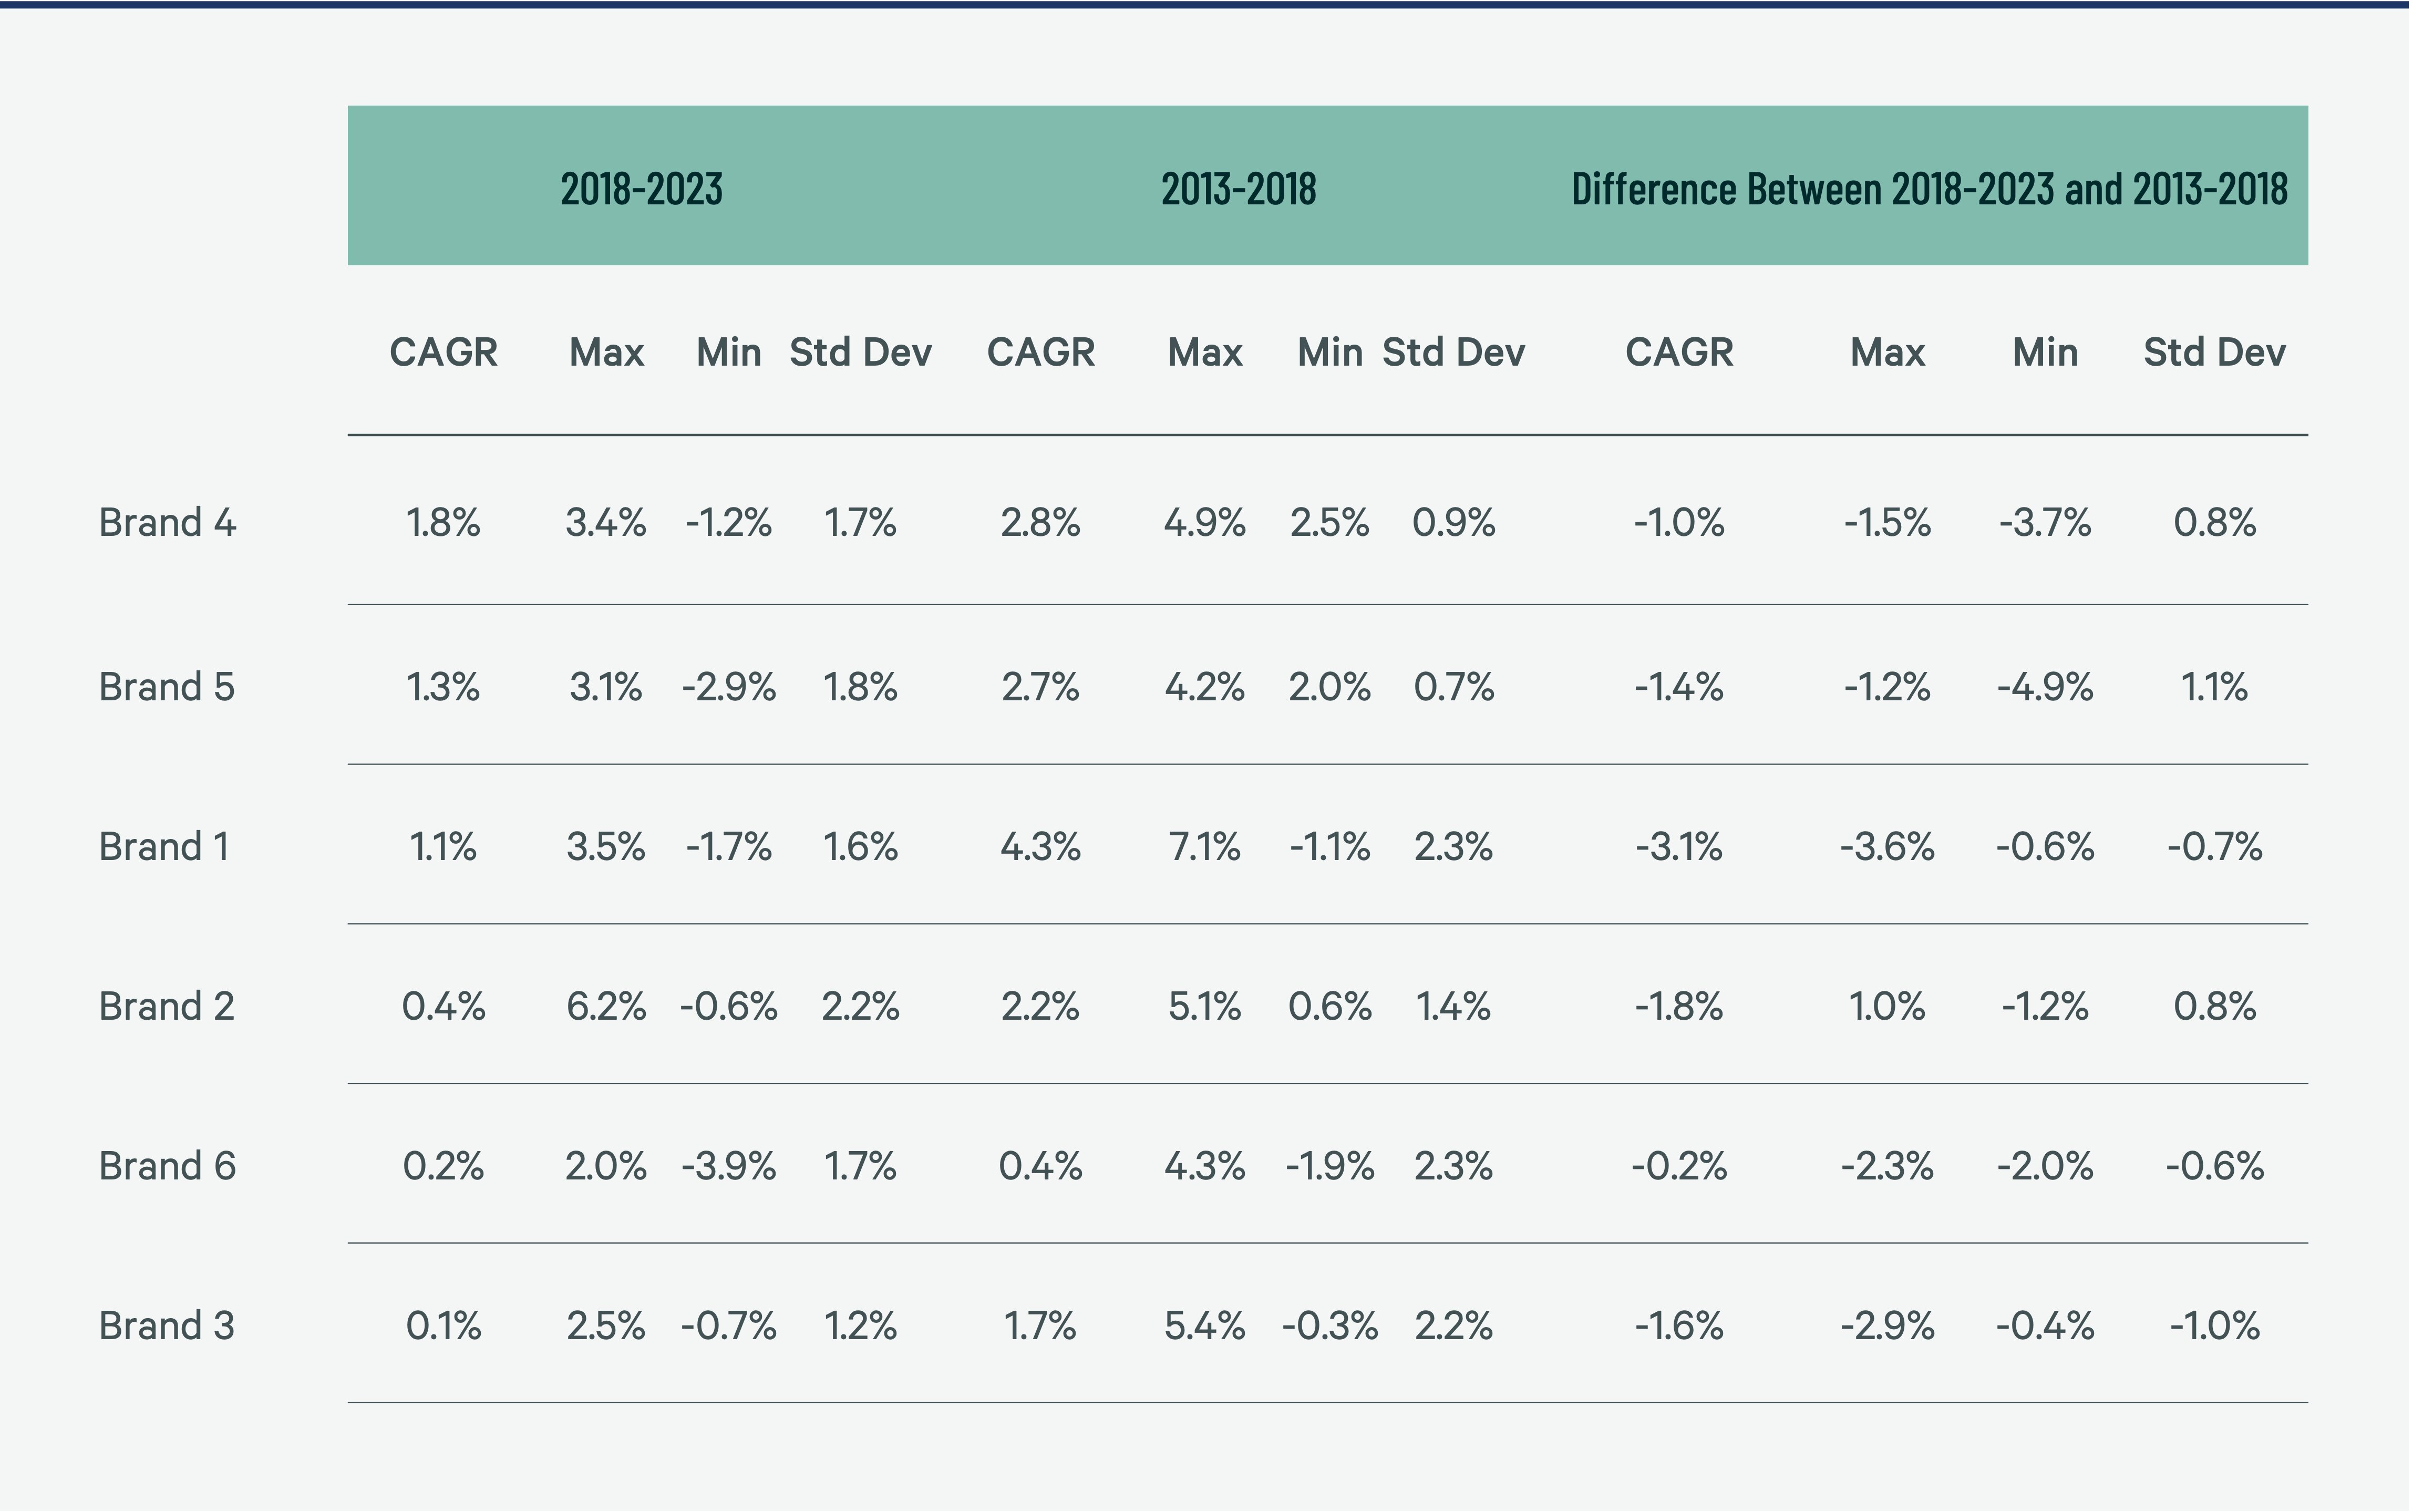
RevPAR growth rates have recently slowed for all brand families. The change in the standard deviation within brand family RevPAR growth was mixed when comparing the two five-year periods. The greater the standard deviation in brand performance within one family, the less likely it is that the brand will perform at or above the average.
Figure 6: RevPAR Growth by Brand

— Source: Choice, Hilton, Hyatt, IHG Hotels & Resorts, Marriott, Wyndham public filings.
Over the past 10 years, the strongest-performing brand family had RevPAR growth of 2.7% vs. 0.3% for the weakest-performing brand family. On a cumulative basis, the strongest brand family outperformed by nearly 27% between 2013 and 2023. Since these two brand families had RevPAR less than $6 apart, we would not attribute the RevPAR growth difference to a variance in chain scale.
Brand performance is not the only metric that an owner should consider when selecting a brand. Others include a brand’s contribution to occupancy, fees, the strength of a brand family’s loyalty program and the performance of the other brands in the brand family. However, slight variances in RevPAR performance can have an oversized impact on returns over the life of an asset.
Figure 7: Brand RevPAR Growth Statistics

— Source: Choice, Hilton, Hyatt, IHG Hotels & Resorts, Marriott, Wyndham public filings.
Methodology
Brand families included in this analysis are Choice, Hilton, Hyatt, IHG Hotels & Resorts, Marriott and Wyndham. Data was gathered from publicly available documents from each company.
For this study, we compared the compound annual RevPAR and room growth rates for 50 brands among six large publicly traded hotel companies that reported key performance indicators from 2013 to 2023. We compared two five-year periods: 2013 to 2018 and 2018 to 2023. We also examined the CAGR for the 13 brands that have started to report KPIs since being launched or acquired in 2018.
The 50 legacy brands include Ascend Collection, Comfort, Clarion, Econo Lodge, Mainstay, Quality Inn, Rodeway, Sleep Inn, Suburban Lodge, Conrad, Doubletree, Embassy Suites, Hampton Inn, Hilton Garden Inn, Hilton Hotels, Home2 Suites, Homewood Suites, Waldorf, Andaz, Grand Hyatt, Hyatt House, Hyatt Place, Hyatt Regency, Park Hyatt, Candlewood Suites, Crowne Plaza, Holiday Inn, Holiday Inn Express, Hotel Indigo, Intercontinental, Staybridge Suites, Courtyard, Fairfield Inn & Suites, Marriott/JW Marriott, Residence Inn, Ritz-Carlton, Sheraton, W Hotels, Westin, Baymont, Days Inn, Hawthorn, Howard Johnsons, Microtel, Ramada, Super 8, Travelodge, Tryp, Wingate and Wyndham.
The 13 brands launched since 2018 include Cambria Suites, Woodspring Suites, Curio, Hyatt Centric, The Unbound Collection, EVEN, Kimpton Hotels, AmericInn, Dolce, La Quinta, Trademark, Wyndham Garden and Wyndham Grand.
To purchase the dataset used in this analysis please visit: https://pip.cbrehotels.com/publications-data-products/hotel-kpis
purchase the dataset
Recent Posts
- Peta Fraksi dan Kilas Balik Pengesahan UU HPP Pangkal PPN 12 Persen
- AmaWaterways offers ‘savings galore’ for wave campaign
- Kapolda DIY Periksa Pistol dan Surat Tes Psikologi Anggotanya
- NEWH, Inc. Awards $75K in Scholarships During BDNY 2024
- Why coal is being burned more than ever as demand in China and India soars despite carbon emissions warnings | Science, Climate & Tech News
Recent Comments